


TON price rallied nearly 15% and traded above the $6.50 resistance. Toncoin is now showing a few signs of trend exhaustion and might correct gains.
- Toncoin jumped above the $6.20 and $6.50 resistance levels.
- The price is now trading above $6.50 and the 100-hourly Simple Moving Average.
- There is a key parabolic curve forming with support at $6.80 on the hourly chart of the TON/USD pair (data source from Kraken).
- The pair could start a downside correction if it declines below $6.80 and the $6.60.
TON Price Reaches $7
Recently, TON price started a strong increase from the $5.60 support zone. It climbed above the $6.20 resistance zone. It gained nearly 15% in a day and outperformed Bitcoin and Ethereum.
Toncoin traded close to the $7.00 level. A high was formed at $6.93 and the price is now consolidating gains. It is trading near the $6.80 zone and well above the 100-hourly Simple Moving Average. There is also a key parabolic curve forming with support at $6.80 on the hourly chart of the TON/USD pair.
Immediate resistance is near the $6.92 level. The first key resistance is near $7.00. A close above the $7.00 resistance zone could spark a strong increase.
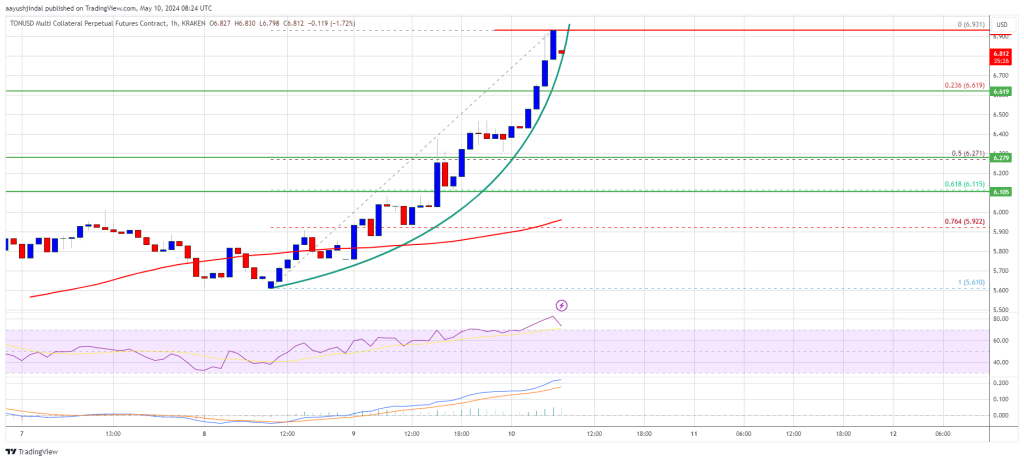
Source: TONUSD on TradingView.com
The next key resistance is near $7.20. If the bulls remain in action above the $7.20 resistance level, there could be a rally toward the $7.55 resistance. Any more gains might send the price toward the $8.00 resistance.
Downside Correction In Toncoin?
If Toncoin price fails to clear the $6.90 resistance zone, it could start a downside correction. Initial support on the downside is near the $6.80 level and the parabolic curve, below which the price might test the 23.6% Fib retracement level of the upward move from the $5.61 swing low to the $6.93 high.
The next major support is at $6.25 or the 50% Fib retracement level of the upward move from the $5.61 swing low to the $6.93 high. If there is a downside break and a close below the $6.25 level, the price might accelerate lower. In the stated case, the price could retest the $6.00 support zone.
Technical Indicators
Hourly MACD – The MACD for TON/USD is now losing pace in the bullish zone.
Hourly RSI (Relative Strength Index) – The RSI for TON/USD is now above the 70 level.
Major Support Levels – $6.80 and $6.60.
Major Resistance Levels – $6.90 and $7.00.

Aayush Jindal
Aayush is a Senior Forex, Cryptocurrencies, and Financial Market Strategist. He specializes in market strategies and technical analysis and has spent over 15 years as a financial markets contributor and observer. He also founded an IT company and works rigorously in providing high-quality software services. Aayush possesses strong technical analytical skills and is well known for his entertaining and informative analysis of the currency, commodities, Bitcoin, and Ethereum markets. Follow him on Twitter @AayushJs.
Disclaimer: The information found on NewsBTC is for educational purposes only. It does not represent the opinions of NewsBTC on whether to buy, sell or hold any investments and naturally investing carries risks. You are advised to conduct your own research before making any investment decisions. Use information provided on this website entirely at your own risk.


